Media lies exposed: Venezuela's economic and social performance under Hugo Chávez, in graphs
Jim McIlroy, an activist from the Australia-Venezuela Solidarity Network, interviewed by ABC TV News, on March 8, 2013, on the significance of Venezuela's socialist President Hugo Chavez. He successfully refutes the misinformation of the hostile "interviewer".
March 10, 2013 – Links International Journal of Socialist Renewal – Following the tragic death of Venezuela's President Hugo Chávez from cancer after 14 years in office, the world's big-business media has gone into overdrive to dishonestly describe Chavez's record as being "authoritarian", "dictatorial" and having made the Venezuelan economy a "basket case", as was rudely interjected by an Australian Broadcasting Corporation "journalist" in the video above. Such media lies have been refuted by Fairness and Accuracy in Reporting and VenezuelAnalysis.
Below the respected Center for Economic and Policy Research exposes the falsity of the charge that Venezuela's economy and social indicators have suffered under the the Bolivarian Revolution.
* * *
By Jake Johnston and Sara Kozameh
March 7, 2013 – Center for Economic and Policy Research – Below is a series of graphs that illustrate the economic and
social changes that have taken place in Venezuela during this time
period.
1. Growth (average annual percent)
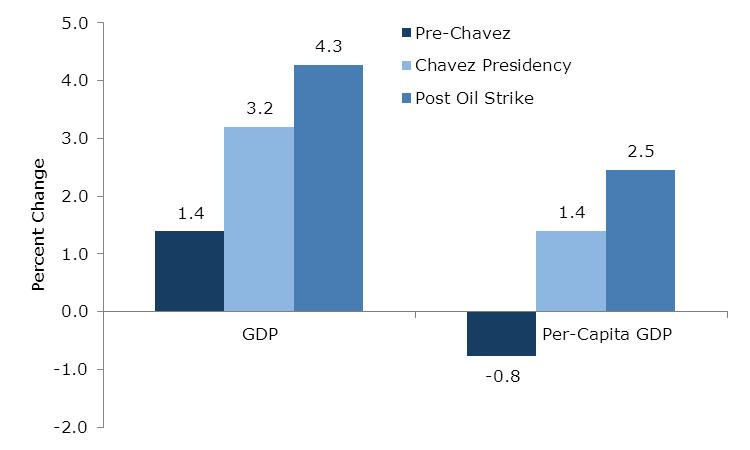
This graph shows overall GDP growth as well as per-capita growth in the pre-Chávez (1986-1999) era and the Chávez presidency.
From 1999-2003, the government did not control the state oil company; in fact, it was controlled by his opponents, who used it to try to overthrow the government, including the devastating oil strike of 2002-2003. For that reason, a better measure of economic growth under the Chávez government would start after it got control over the state oil company, and therefore the economy.
Above you can see this
growth both measured from 2004, and for the 1999-2012 period. We use
2004 because to start with 2003, a depressed year due to the oil strike,
would exaggerate GDP growth during this period; by 2004, the economy
had caught up with its pre-strike level of output. Growth after the
government got control of the state oil company was much faster.
2. Public vs. private Growth – 1999-2012 (average annual per cent)
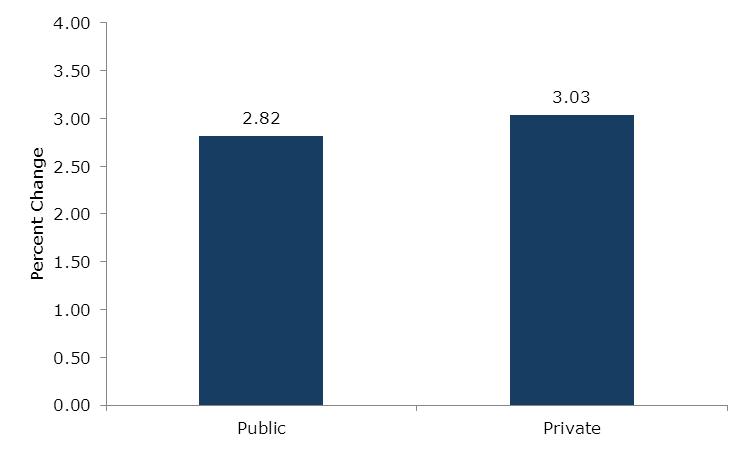
This graph shows the growth of the private sector versus the public sector during the Chávez years.
3. Inflation: pre-Chávez vs. Chávez years
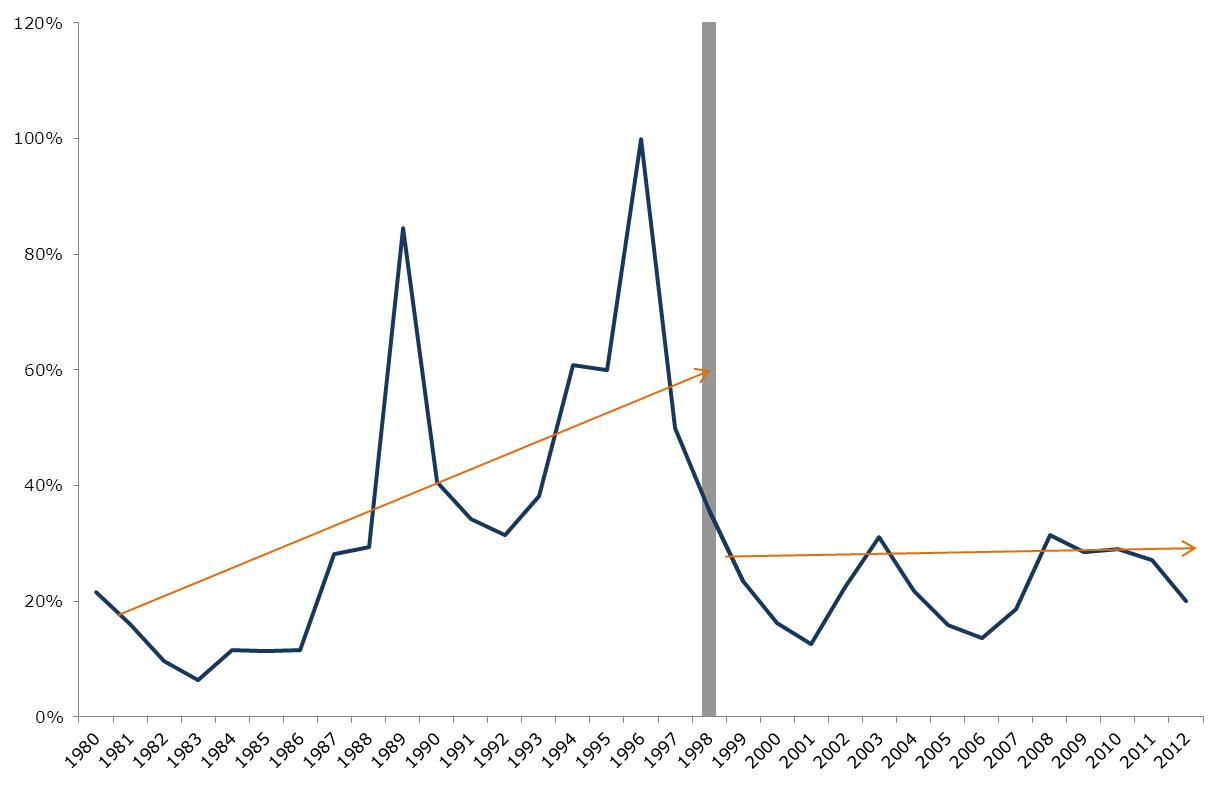
Inflation in Venezuela, consumer price index.
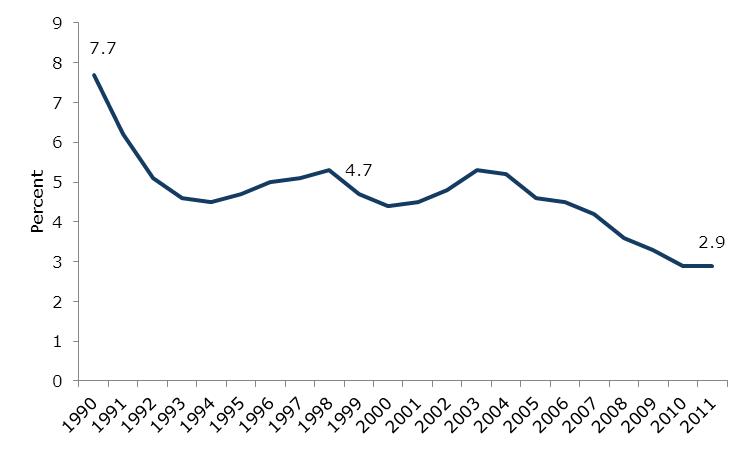
4. Unemployment rate: before and after oil bosses strike
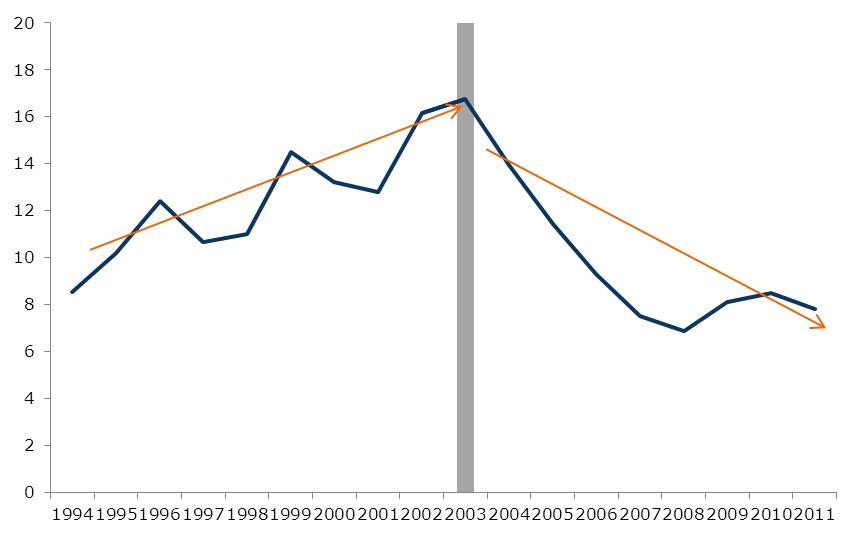
After the oil strike (and the deep recession that it caused) ended in 2003, unemployment dropped drastically, following many years of increases before Chávez was elected. In 1999, when Chávez took office, unemployment was 14.5 percent; for 2011 it was 7.8 percent.
5. Poverty and extreme poverty rate
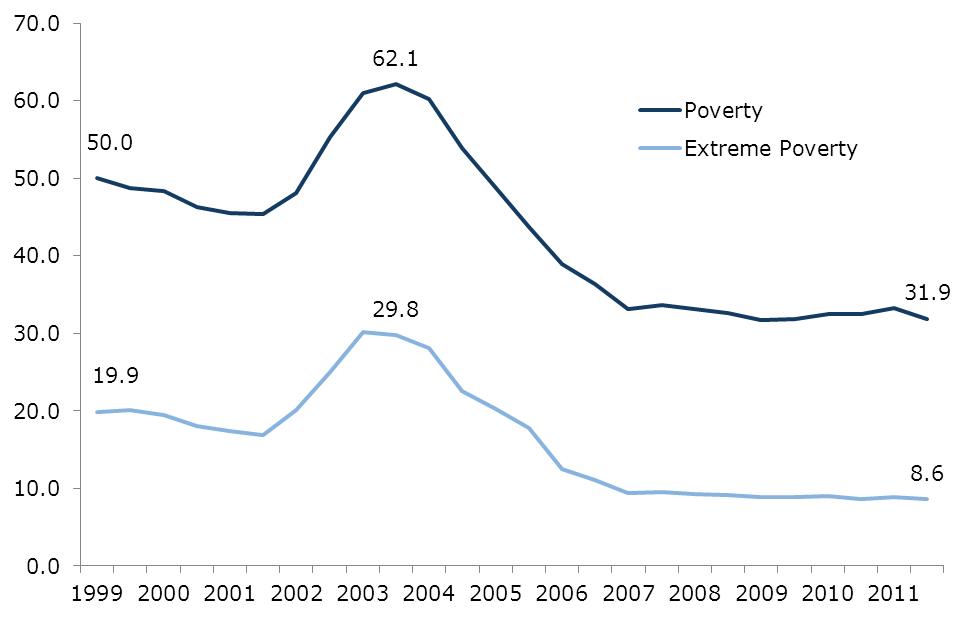
Poverty
has decreased significantly, dropping by nearly 50 percent since the
oil strike, with extreme poverty dropping by over 70 percent.
6. Gini coefficient, 2001-2003 Latin America
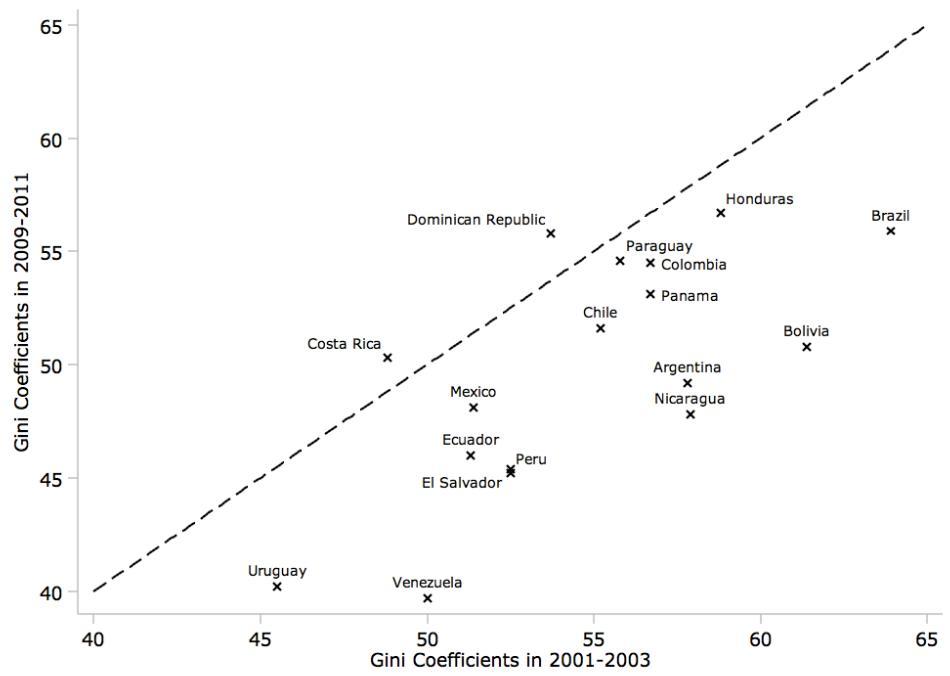
The Gini coefficient, measuring income inequality, fell from 0.5 to 0.397, the lowest Gini coefficient in the region.
7. Social spending as a per cent of GDP

Social spending doubled from 11.3 per cent of GDP in 1998 to 22.8 per cent of GDP in 2011.
8. Education: net enrollment

9. Graduates from higher education
10. Child malnutrition age 5 and under
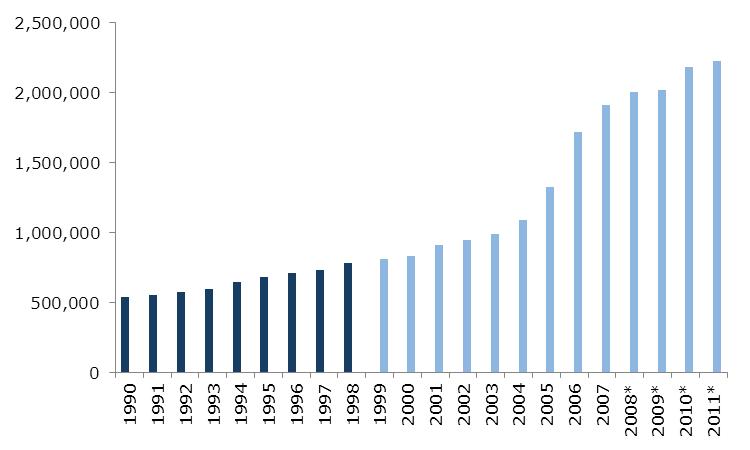
11. Venezuelans receiving pensions
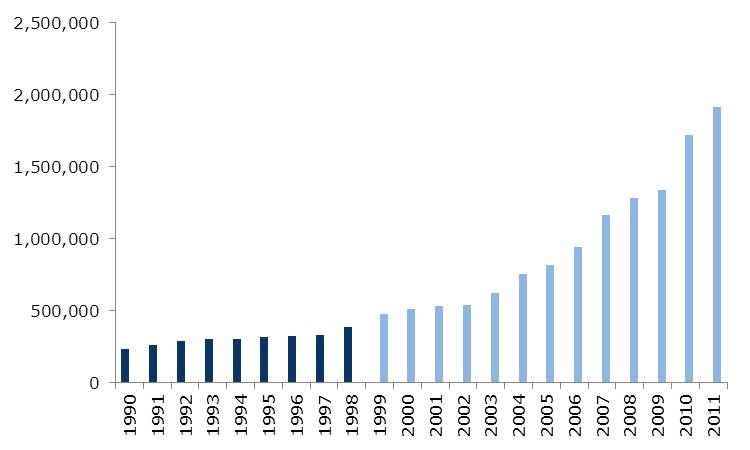
The number of Venezuelans receiving pensions has increased from less than 500,000 in 1999 to nearly 2 million in 2011.