Global wealth inequality: top 1% own 41%; top 10% own 86%; bottom half own just 1%
By Michael Roberts
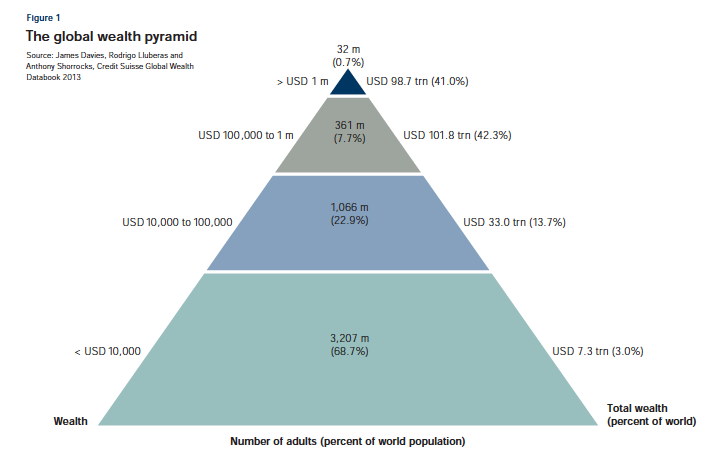
October 10, 2013 -- Michael Roberts' Blog – Just 8.4% of all the 5 billion adults in the world own 83.4% of all household wealth (that’s property and financial assets, like stocks, shares and cash in the bank). About 393 million people have net worth (that’s wealth after all debt is accounted for) of over $100,000, that’s 10% own 86% of all household wealth!
But $100,000 may not seem that much, if you own a house in any G7 country without any mortgage. So many millions in the UK or the US are in the top 10% of global wealth holders. This shows just how little two-thirds of adults in the world have – under $10,000 of net wealth each and billions have nothing at all.
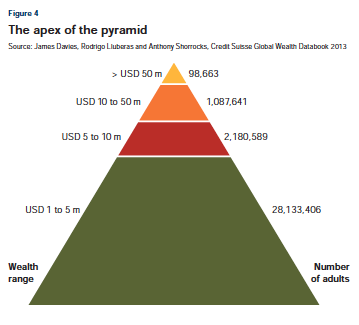
This is not annual income but just wealth – in other words, 3.2 billion adults own virtually nothing at all. At the other end of the spectrum, just 32 million people own $98 trillion in wealth or 41% of all household wealth or more than $1 million each. And just 98,700 people with "ultra-high net worth" have more than $50 million each and of these 33,900 are worth over $100 million each. Half of these super-rich live in the US.
All this is in a new global wealth report published Credit Suisse Bank and authored by professors Anthony Shorrocks and Jim Davies – see the report at global wealth report and the wealth database). The professors find that global wealth has reached a new all-time high of $241 trillion, up 4.9% since last year, with the US accounting for most of the rise. Average wealth hit a new peak of $51,600 per adult but the distribution of that wealth is wildly unequal.
There is nothing new in this report in one sense because Tony Shorrocks previously authored a UN report back in 2010 (see my post, http://thenextrecession.wordpress.com/2010/01/10/20/) that found virtually the same wealth inequality. Branko Milanovic also found similar figures in various World Bank studies. But what is also interesting is that Professor Shorrocks finds that there is little or no social mobility between rich and poor over generations – 87% of people stay rich or poor, hardly moving up or down the wealth pyramid.
This inequality is mirrored within each country (see UK wealth distribution). In the UK, aggregate total wealth (including private pension wealth but excluding state pension wealth) of all private households in Great Britain was £10.3 trillion. And the wealthiest 10% of households were 4.4 times wealthier than the bottom 50% of households combined. The wealthiest 20% of households owned 62% of total aggregate household wealth.
Moreover, according to the Credit Suisse report, the "American dream" or the British idea of "rags to riches" is a myth. Two-thirds of US adults are in the same wealth decile as their parents were. Even globally, “while some individuals do alternate wildly between rags and riches, many stay for their whole lifetime in the same wealth neighborhood for people of their age. Dividing the population into wealth quintiles, about half the population remains in the same quintile after ten years and we estimate that at least a third would be in the same quintile after thirty years.”
Global wealth is projected to rise by nearly 40% over the next five years, reaching $334 trillion by 2018. Emerging markets will be responsible for 29% of the growth, although they account for just 21% of current wealth, while China will account for nearly 50% of the increase in emerging economies’ wealth. Wealth will primarily be driven by growth in the middle segment, but the number of millionaires will also grow markedly over the next five years.
All class societies have generated extremes of inequality in wealth and income. That is the point of a rich elite (whether feudal landlords, Asiatic warlords, Incan and Egyptian religious castes, Roman slave owners etc.) usurping control of the surplus produced by labour. But past class societies considered that normal and "god-given". Capitalism on the other hand talks about free markets, equal exchange and equality of opportunity. But the reality is no different from previous class societies.
From the extremely wealthy to more than a billion in extreme poverty
By Michael Roberts
October 11, 2013 – Michael Roberts Blog – The World Bank has now released a report (World Bank state of the poor) covering the other end of spectrum – the level of extreme poverty in the world. There are roughly 1.2 billion people completely destitute (living on less than $1.25 a day), one-third of which are 400 million children. One of every three extremely poor people is a child under the age of 13. This is "extreme poverty", compared with the United States’s own poverty line at about $60 a day for a family of four. People in “extreme poverty” tend to lack enough food to meet basic physical and mental needs. So there are over 1 billion people, one-thirds of them children, who are virtually starving in the 21st century.
The World Bank says that the number of people living in extreme poverty has sharply declined over the past three decades. There are 721 million fewer people lived in extreme poverty in 2010 compared to 1981 (assuming what $1.25 a day could buy in 1981 is the same as what it can buy now). That sounds better, but this reduction is almost solely due a rise in living standards in the billion-plus populations of India and particularly China in the last 30 years. There has been very little reduction in extreme poverty levels (as defined) in other very poor emerging economies. While extreme poverty rates have declined in all regions, the world’s 35 low-income countries (LICs) – 26 of which are in Africa — registered 103 million more extremely poor people today than three decades ago. Aside from China and India, “individuals living in extreme poverty [in the developing world] today appear to be as poor as those living in extreme poverty 30 years ago”, the World Bank said.
In 2010, 33% of the extreme poor lived in low-income countries, compared to 13% in 1981. In India, the average income of the poor rose to 96 cents in 2010, compared to 84 cents in 1981, and China’s average poor’s income rose to 95 cents, compared to 67 cents. China’s state-run still mainly planned economy saw its poorest people make the greatest progress. But the “average” poor person in a low-income country lived on 78 cents a day in 2010, compared to 74 cents a day in 1981, hardly any change.
Three quarters, or 78%, of those living in extreme poverty live in rural areas, with nearly two-thirds of the extreme poor deriving their livelihoods from agriculture. The extreme poor also continue to lag significantly behind in access to basic services. Only 26% of the poor had access to clean water in 2010, compared to 56% among those living above the $1.25 poverty line (hardly an income). Meanwhile, fewer than half – 49% – of the extreme poor had access to electricity compared to 87% of the "non-poor". And while 61% of those above the $1.25 poverty line had access to basic sanitation, just 20% of the extreme poor had access to similar services.
As a share of the GDP of the developing world, the Aggregate Poverty Gap is now less than one-10th of what it was 30 years ago. For LICs, the share in 2010 was approximately 8% of their GDP, down from 24% in 1981. Notwithstanding this significant decline, the Aggregate Poverty Gap/GDP ratio in LICs is 16 times larger than the average for the developing world. “To reach the goal of ending extreme poverty by 2030, the pace of poverty reduction in LICs will have to increase substantially.”
What is also interesting is that, except for LICs, lack of resources are unlikely to be the main limitation to ending extreme poverty in most countries. As the World Bank puts it: "The challenge for middle and high income groups is not so much the amount of resources required by the poor, but development and implementation of policies and programs that help redirect those resources to the poor. For LICs, however, resources are still likely to be a major constraint to ending extreme poverty. ”
That means that poverty (as defined) could be ended if governments chose to do so. The World Bank explained it this way:
Suppose that the real GDP growth for the developing world as a whole is 5 percent per year. If 10 percent of this GDP growth accrued to the 21 percent of the developing world’s population who are extremely poor, and this 10 percent was distributed in a way that the growth in income of each poor person was exactly his/her distance to the $1.25 line, extreme poverty would end in one year.
Fat chance!
Global wealth
Its a terrible situation everywhere. In our country we have now only the upper class and the bottom class. Middle class is fading away and merging with bottom class.
I strongly believe that it will get even worse.